Gathering Results During Testing in the Field
Whether you are in a lab or operating remotely, you need appropriate test resources, with the emphasis on accuracy, flexibility, portability and affordability.

07 Aug, 2024. 7 min read
Building a sensing application offers a host of exciting engineering challenges. Many sensing techniques start their life in the company laboratory or university research center. This testing ground refines methods, hardware, and software to measure a specific physical property. If the sensing technology demonstrates a significant cost saving, reduction in physical volume, or drop in power usage over existing methods, efforts are made to commercialize it.
Micro-electromechanical systems (MEMS) are a great example. Devices like the resonant gate transistor[1], created in the late 1960s, are considered one of the first examples of this technology. Later, during the 1980s and 90s, mass manufacturing techniques for micromachining silicon MEMS sensors were developed, opening the doors to a range of new sensing devices.
Today, it’s challenging to imagine a world without MEMS technology. The inertial measurement unit (IMU) that got a man to the moon was large and bulky[2]. By comparison, MEMs sensors that measure millimeters on a side and weigh basically nothing are integrated into every smartphone.
Keeping Tabs on Power Consumption
Internet of Things applications typically include some sort of sensing, allowing the node to share data about its surroundings or operation, even if sensing is not its primary function. Such data can be stored to keep track of temperature, humidity, or vibration during operation. It might then be combined with other data to perform predictive maintenance or explore the reasons for field failure of a device.
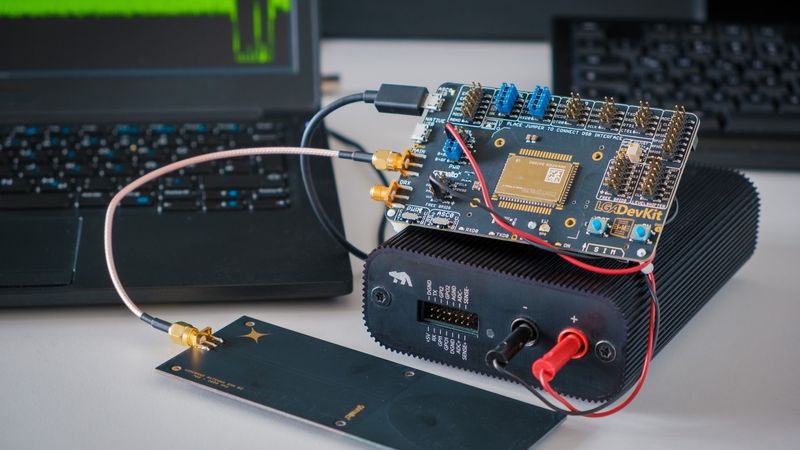
If the device is battery-powered, the engineering team will want to fully understand the impact of such overhead functionality on the power budget. After all, while the insights the sensor delivers can be helpful, it can’t be at the expense of battery life. An excellent tool for exploring this is the Qoitech Otii Arc Pro[3].
Inside is a two-quadrant source measurement unit (SMU) that can source voltage and current while measuring them. This allows developers to power their application, measure the current drawn, and determine energy consumption. With such data, the lifetime of a power source, such as a battery or energy harvesting circuit, can be determined.
The anodized black case features two banana sockets that power the target application (Figure 1). When powered via the USB interface, developers have a supply configurable from 0.5 V to 4.2 V. Adding an external power supply (7.5 V – 9 V) enables the output to be increased to 5.0 V. The voltage setting has a resolution of 1 mV, while the output current can reach 2.5 A continuous and 5.0 A peak with the external power supply.
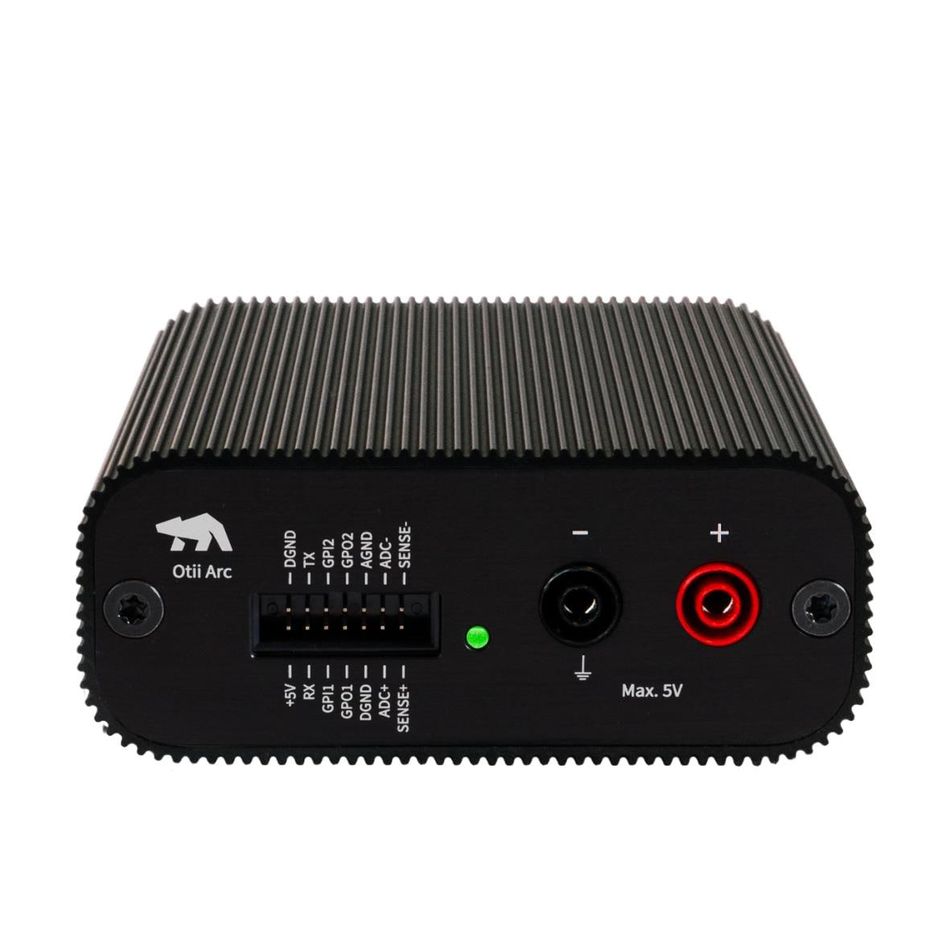
On the measurement side, the Otii Arc offers an analog bandwidth of 400 Hz, a sample rate of 1 ksps for voltage, and between 1 ksps and 4 ksps for current, depending on the measurement range. It also provides a wide current measurement dynamic range, covering nine orders of magnitude from nA to A.
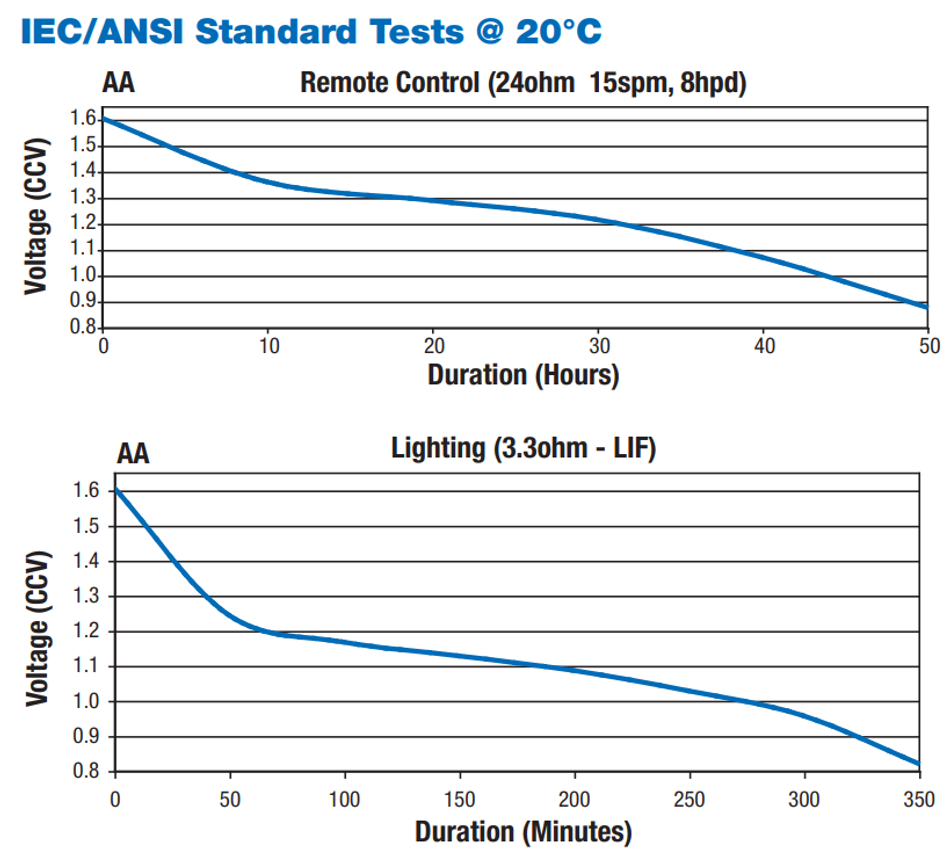
This combination of source and sink not only allows power consumption measurement but also supports the analysis of the batteries you intend to use in your application. Battery datasheets usually provide some discharge profiles, but it is challenging to extrapolate this accurately for your own use case (Figure 2). The Otii software provides a Battery Toolbox[4] feature for undertaking such measurements, enabling you to create a clear picture of battery profile under varying discharge conditions.
With the profiles captured, Otii Arc can then emulate those batteries while connected to your circuit (Figure 3). This provides a range of insights. Battery life can then be determined, such as under good and poor radio link conditions. To explore how your circuit handles potential brown-out conditions, you can also replay a section of the battery life, such as the final portion where the output voltage rapidly drops off.

All configurations and settings are saved as projects, allowing measurement setup, battery profiles, and measurements to be recalled for repeat testing and analysis. Furthermore, a software API is also available to undertake long-term testing or test automation.
What’s the Sensor Saying?
When expected battery life falls significantly short, one of the usual issues is that something is waking the application more often than expected. But tracking down the cause can be tricky. For example, the application code responsible may only triggered under corner-case conditions. Luckily, plenty of PC-based tools can be used as data loggers to capture what is going on over long periods of operation.
The Analog Discovery Pro ADP2230[5] is a mixed signal oscilloscope (MSO), but like many of Digilent’s measurement tools, its USB connection to your PC delivers heaps of extra flexibility. In fact, calling it an oscilloscope rather understates its functionality. The tool includes a waveform generator and programmable power supply, and the 16 digital inputs can also be configured as outputs for generating communication protocols (Figure 4).
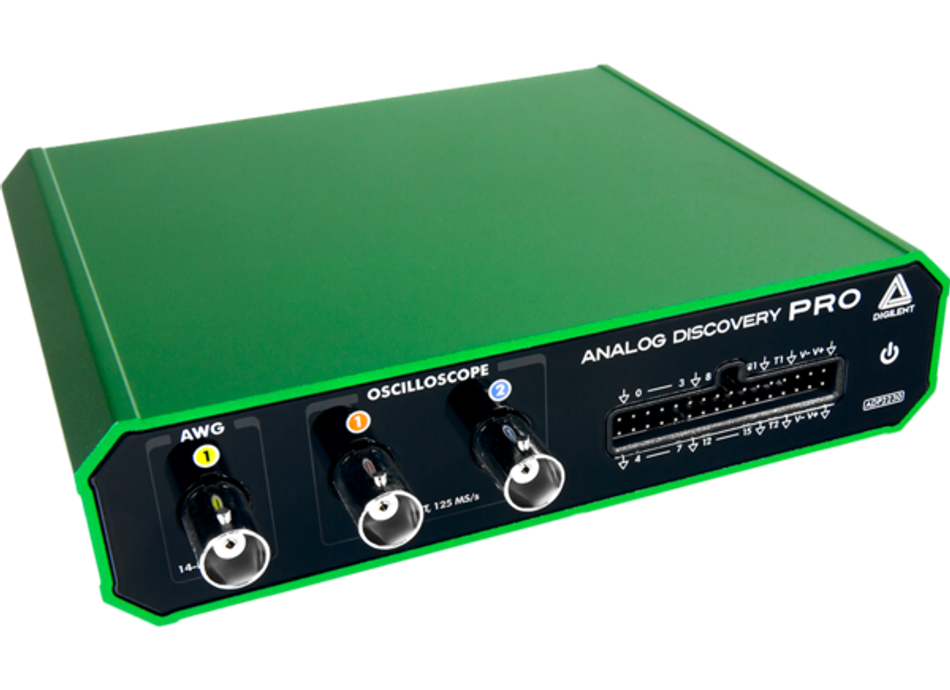
With a lot packed in, it’s best to check out the datasheet[6] for the full specifications. However, to provide a taste of its capabilities, the two oscilloscope inputs offer 14-bits of resolution at a sampling rate of up to 125 MS/s, 50 MHz bandwidth, and ±25 V input range; the waveform generator offers the same specifications with a bandwidth of 15 MHz and ±5 V output; and same applies to the digital section that supports 3.3 V CMOS levels while being 5 V tolerant for input. The power supply has two channels configurable to ±0.5 V to ±5.0 V at 3 W per channel.
Digilent’s Waveforms[7] software is the starting point for configuring the tool and visualizing your measurements. And, like their other tools, their application programming interface Waveforms SDK[8] enables you to create your own programs to control the device and capture data. Languages supported include C, Python, and others.
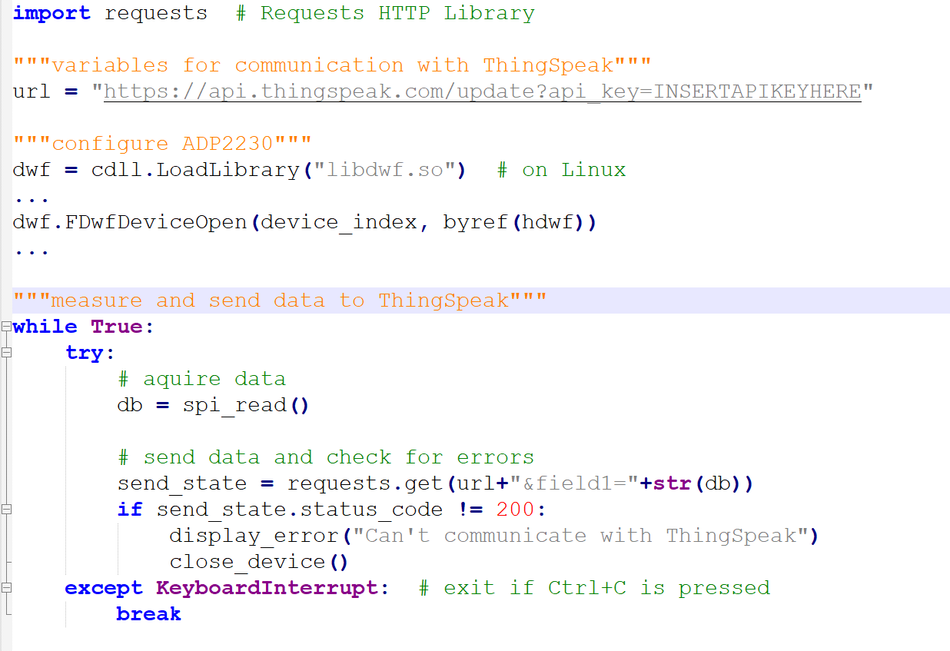
While such collection of raw data is very helpful, an ongoing challenge for many is the visualization of the data and sharing it with the broader team. Tackling this is ThingSpeak[9], a MathWorks platform for collecting, viewing, and analyzing data in the cloud. Digilent provides some example projects[10], but it will seem relatively straightforward if you’ve already used similar cloud services. Users simply create a ThingSpeak project, obtain an API key, and then add it to their code. After loading the Waveforms SDK library (Windows/Linux/macOS), the data to be logged is sent using an HTTP get method (Figure 5). ThingSpeak also offers MATLAB analysis and visualization tools, gauge and chart plugins, timed control tasks, and automated responses.
Monitoring Your RF Connection
When it comes to test equipment, a big box is always available to measure what you need. However, there isn’t always the space to accommodate it, especially if you want to make measurements in the field. And, for RF connectivity, field measurements help clarify how the environment impacts radio link quality and why your battery is not lasting as long as you calculated.
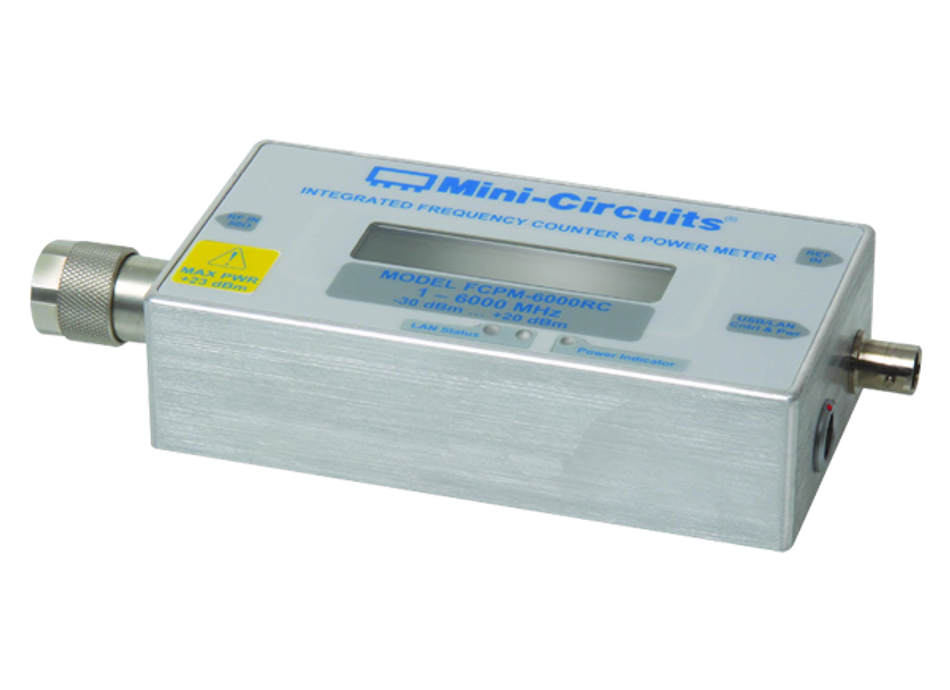
This is what makes the Mini-Circuits Integrated Frequency Counter and Power Meter[11] (FPCM) so compelling because it delivers two RF tools in a compact 5.0” × 2.6” × 1.4” package (Figure 6). The tool can be used standalone thanks to the integrated LCD. Frequency resolution is 1 Hz, 10 Hz, or 100 Hz, depending on the frequency range, and measurements from 1 MHz to 6 GHz are possible. It also has an internal 10 MHz reference, although it is possible to supply your own using the BNC connector. An N-type male 50 Ω input is provided for connection to the system under test, and the unit also provides a dynamic range of -30 to +20 dBm.
The included cable also allows the meter to be connected to a PC via either USB (which is also used as a power source) or Ethernet. It’s even possible to power and connect the unit via a Power-over-Ethernet (PoE) splitter if you’re performing measurements remotely.
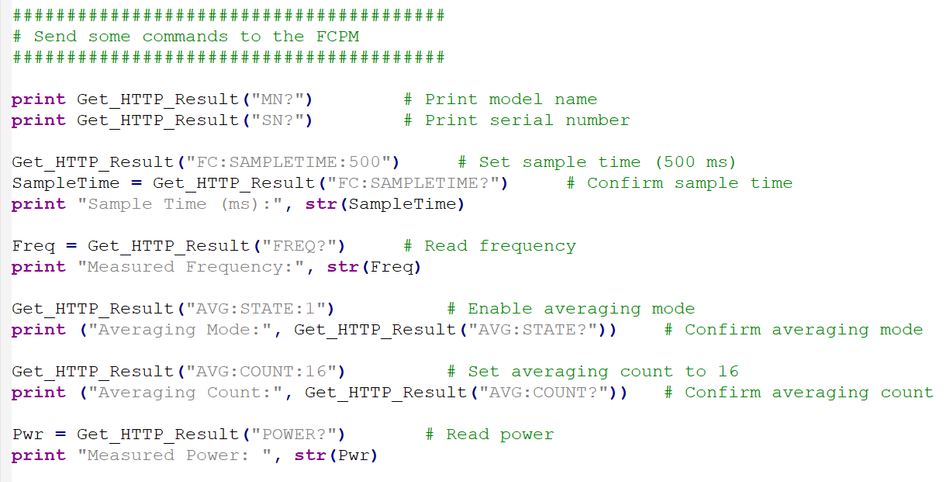
Using the available FPCM software GUI[12], the meter can be configured and measurements saved. Compensation at all frequencies can be defined in a simple text file if your test setup results in gains or losses. Alternatively, USB DLLs for Windows or an HTTP method over Ethernet for Windows and Linux are available[13], allowing developers to create their own long-term test setups or test automation systems (Figure 7).
Compact, Portable, and Ready to Test!
Whether you have an RF application targeting the IoT or a simple, battery-powered embedded system, field and long-term testing is often needed to understand hard-to-find functional issues or how environmental factors impact operation. Power consumption, especially over several orders of magnitude, is challenging to measure with conventional test equipment. The same applies to the frequency and power of RF systems, as test tools are often large, bulky, and require a mains supply. However, all the equipment listed here is small, portable, and programmable, thanks to software APIs and SDKs, leaving you ready to gather the data you need, whether for minutes, hours, or days.
Resources
[1] https://ieeexplore.ieee.org/document/1474635
[2] https://wehackthemoon.com/tech/inertial-measurement-unit-mechanical-engineering-wizardry
[3] https://eu.mouser.com/new/qoitech/qoitech-otii-arc-pro/
[4] https://www.qoitech.com/battery-toolbox/
[5] https://eu.mouser.com/new/test-measurement/digilent-analog-discovery-pro-adp2230-mso/n-5gf3Z36ugzx
[6] https://eu.mouser.com/pdfDocs/analog-discovery-pro-2230-datasheet.pdf
[7 https://digilent.com/shop/software/digilent-waveforms/
[8] https://digilent.com/reference/software/waveforms/waveforms-sdk/start
[9] https://thingspeak.com/
[10] https://digilent.com/reference/software/waveforms/waveforms-sdk/thingspeak
[11] https://eu.mouser.com/new/test-measurement/frequency-counters/mini-circuits-fcpm-6000rc-meters/n-7uqigZ2mmftr
[12] https://www.minicircuits.com/softwaredownload/fcpm.html
[13] https://www.minicircuits.com/WebStore/pte_example_download.html?fam=Power%20Meter%20_%20Frequency%20Counter