Data Transformation Using Knowledge Graphs
A brief introduction to Graph Theory

11 Apr, 2022. 7 min read

Tags
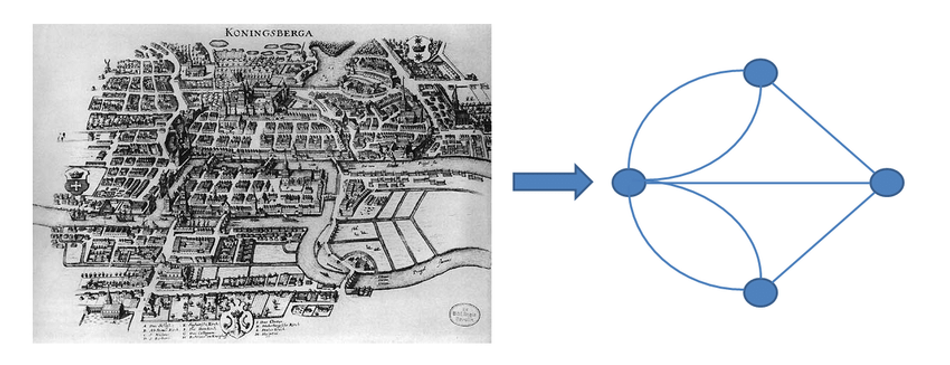
The concept of a graph was introduced in the 18th century by one of the most eminent Mathematicians of all time, Leonhard Euler. His proof that there is no solution to the puzzle “Seven Bridges of Königsberg”[1] in 1736 laid the foundations of graph theory.
Source: Johnson, Samuel & Thesis, Advisors & Torres, Joaquín & Torres, Agudo & Marro, Joaquín & Granada, Borau & April,. (2011). Interplay between Network Topology and Dynamics in Neural Systems.
Graph theory is the study of graphs, which are mathematical structures used to model relations between objects. A graph in this context is made up of nodes that are connected by edges. Ultimately, it's a study of relationships. Given a set of nodes and connections, which can abstract anything from railways to computer data, graph theory provides a helpful tool to quantify & simplify the many moving parts of dynamic systems. Studying graphs through a framework provides answers to many arrangements, networking, optimization, matching, and operational problems. There are different types of graphs including; Undirected, Directed and Weighted graphs.[2]
Today in the world of vast data, the whole internet is a virtual graph. From a simple Google search to YouTube video recommendations, consumers are regularly benefiting from the applications of graph theory. Graph-theoretic methods, in various forms, have proven particularly useful in linguistics. Graphs can be used to identify patterns in documents, cluster documents by finding similarities, etc, in a scalable way. It provides a unique approach to understanding and analysing huge chunks of data enabling the users to gain insights and drive solutions.
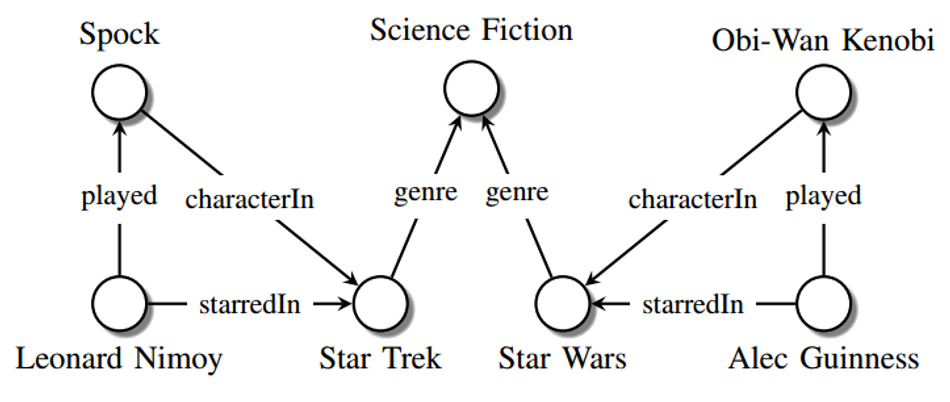
A graph representing a network of real-world entities and illustrating the relationship between them is called a knowledge graph or semantic network. The capability of knowledge graphs to understand complex relations from data using natural language processing accelerated its momentum. Building a knowledge graph can be advantageous for visualization, insight derivation, and computational efficiency since graph algorithms can be orders of magnitude faster and enriched with relations compared to conventional database algorithms in many applications.
Understanding Knowledge Graphs
A knowledge graph is a way to find unknown relationships between previously disconnected data sets that cannot be identified through traditional means. It can understand connections in datasets that differ in their structure and size. Knowledge graphs combine the schemas, identities, and context to provide structure to the raw data.
The schemas will make the skeleton of the graph, the identities classify the nodes and the context guides the setting in which that knowledge exists. Utilising natural language processing-based semantic enrichment, graphs can easily distinguish words with multiple meanings. This is what enables the Google search engine to understand the difference between apple as fruit and Apple as a brand.
When data is ingested, sematic enrichment allows knowledge graphs to identify individual objects and understand the relationships between different objects. This knowledge is then compared and integrated with other datasets, which are relevant and similar. Once a knowledge graph is complete, it can provide a question & answer search system and intelligent querying to retrieve and reuse comprehensive answers to given queries.
This enables the user to access their raw data faster and support business decision-making with multiple stakes of concerns than would otherwise be the case. The data integration efforts around knowledge graphs can also support the creation of new knowledge, establishing connections between data points that may not have previously been realized.[3]
Source: Maximilian Nickel et al. A Review of Relational Machine Learning for Knowledge Graphs: From Multi-Relational Link Prediction to Automated Knowledge Graph Construction
Increasing Data and the significance of Knowledge Graphs
According to Statista, the amount of data generated is expected to grow to an enormous 181 zettabytes (ZB) by 2025 [4]. This will be approximately the space required to store 181 trillion movies of 1GB each. The number has increased exponentially in such a way that 90% of the total data was created in the last two years. A study by Techjury infers that poor data quality costs the US economy up to $3.1 trillion yearly[5]. With the advent of technology, about 80-90% of the data created today is unstructured (images, videos, audios, PDFs, etc) which makes it even harder for organisations to extract information and derive insights. In 2018, an IBM study showed that up to 80% of an organization’s data is dark data — data that an organization collects and stores, but that is not found by users and hence not exploited.[6]
Thus, to solve complex real-world problems, there is a need to integrate multiple unstructured and semi-structured sources of data from multiple sources and infer insights. This requires a connected, reusable and flexible data foundation. This is where the concept of knowledge graphs comes into the picture. The confluence of data connectivity via the internet, graph computations over data, and progress in NLP and Computer Vision to extract relations from texts and images enabled knowledge graphs to drive significant improvements in data utilization.
One of the major advantages of knowledge graphs is their scalability. The knowledge graphs that are available today are of unprecedented scale. For example, a recent version of the Google knowledge graph had over 570 million entities and over 18 billion relationships[7]. This large scale of knowledge graphs makes the efficiency and scalability of the graph algorithms paramount. In their 2022 Tech Radar, Gartner identified graph technology as a critical enabler of smart cities, IoT, digital twins, artificial intelligence and machine learning[8].
Graph database technology is specifically designed and optimized for highly interconnected datasets to identify patterns and hidden connections. Graph data stores are intuitive because they mirror the way the human brain thinks and maps associations via neurons (nodes) and synapses (relationships). A graph database efficiently stores and queries connected data in a node-and-relationships format. As a result, graph technology excels at problems where there is no prior knowledge of path length or shape by using graph storage and infrastructure to find neighbouring data efficiently[9]. Thus they are ideal for storing, manipulating, and analyzing the widely varied perspectives in the graph model due to their graph-specific processing languages and capabilities, scalability, and computational power.
Meet Compass: Engine™, Graph Technology-based Decision Intelligence
According to research by Anaconda[10], almost 40% of a data scientist's time is spent on making data ready for analysis – time that could be spent on discovering insights and IDC suggested the problem could be even worse – with less than one-third of an analysts time spent on actual analysis. For non-data scientists, the proportion of time is probably significantly greater. With the massive increase in data coming our way, a new approach is needed.
Research by EY[11], a global leader in business strategy, and others helped identify several factors that were making it difficult for organizations to become more data-driven in their operations and business decisions. These included:
● Data is siloed, disconnected and lacks the links that a technique like a graph technology could overcome
● There is a shortage of specialist data skills making it hard to adopt expert analyst tools widely in organizations
● The total cost of ownership (TCO) of traditional analytics tools compounds the skills challenge by making it prohibitively expensive to scale their deployment in an organization beyond a small, core group
● Data-based decision making is now a team sport, but sharing advanced analytic outputs vertically and horizontally in an organization is difficult in traditional desktop-based systems
Slingshot Simulations, a start-up that spun out of the University of Leeds, UK, in 2019, has developed and released a decision intelligence platform technology called Compass: Engine™ that aims to overcome these key hurdles. Firstly, it is based on graph and, uniquely, bi graph technology to automatically discover links between an organization’s disconnected data.
Second, it is a no-code environment with a highly intuitive user interface supported by domain-specific apps that makes it easy for non-data scientists to use in their everyday work. Third, it is orders of magnitude lower in cost than traditional enterprise software and starts with a free to use community version. And finally, it is a cloud-based platform-as-a-service that enables access from across an organization with projects and dashboards that can be directly shared from within the platform. It’s like social media meets data science.
And Compass: Engine™ is more than automated data discovery, visualisation and analytics. It includes the ability to launch simulations using data to explore what-if scenarios. For example, in one recent application, the technology has been used to simulate likely traffic, cycling and pedestrian movements in a new sustainable mobility initiative and weave the results of these simulations into socio-economic, health and air quality impacts on the local area. This simulation capability paves the way for digital twins and lays a foundation to accelerate the development of machine learning and artificial intelligence programs.
Slingshot Simulations are encouraging people to sign up for the free community version of the software as they believe that only by collaborating can we use data to help solve the biggest challenges we face today – whether environmental sustainability, climate resilience, resource scarcity, and more. Explore what you can do with your own and community data in Compass: Engine™ with the free community edition from here.
About the sponsor: SlingshotSimulations
Slingshot Simulations is on a mission to enable anyone, anywhere to unleash the power of advanced data science to tackle the biggest challenges we face today – sustainability, climate resilience, decarbonisation, and more. Their technology removes the barriers to entry of cost, usability and domain expertise.
The community version of Compass: EngineTM Graph Technology Platform-as-a-Service is freely available. Its no-code environment supported by automated workflows and an intuitive user experience make it fast and easy to use, even by non-data scientists. Apps and extensions integrate our solution into your technology stack and tools of choice. What data will you make “intelligence ready” today?

References:
[1] Graph theory - Wikipedia [Internet]. En.wikipedia.org. 2022. Available from: https://en.wikipedia.org/wiki/Graph_theory
[2] What is Graph Theory, and why should you care? [Internet]. Medium. 2020. Available from: https://towardsdatascience.com/what-is-graph-theory-and-why-should-you-care-28d6a715a5c2
[3] Education I. What is a Knowledge Graph? [Internet]. Ibm.com. 2021. Available from: https://www.ibm.com/cloud/learn/knowledge-graph
[4] Topic: Big data [Internet]. Statista. 2022. Available from: https://www.statista.com/topics/1464/big-data/#dossierKeyfigures
[5] 25+ Impressive Big Data Statistics for 2022 [Internet]. Tech Jury. 2022. Available from: https://techjury.net/blog/big-data-statistics/
[6] Illuminate Dark Data — Part 1 [Internet]. Medium. 2021. Available from: https://medium.com/ibm-data-ai/illuminate-dark-data-part-1-c3c2028f91af
[7] The Role of Knowledge Graphs in Artificial Intelligence [Internet]. Techopedia.com. 2021. Available from: https://www.techopedia.com/the-role-of-knowledge-graphs-in-artificial-intelligence/2/34517
[8] 5 Impactful Emerging Technologies for 2022 [Internet]. Gartner. 2021. Available from: https://www.gartner.com/en/articles/5-impactful-technologies-from-the-gartner-emerging-technologies-and-trends-impact-radar-for-2022
[9] A Brief Introduction to Graph Data Platforms Dave Packer, VP, Product Marketing, Neo4j. 2020. Available from: https://www.carahsoft.com/download_file/view/105074
[10] Anaconda | State of Data Science 2021 [Internet]. Anaconda. 2022. Available from: https://www.anaconda.com/state-of-data-science-2021
[11] [Internet]. Assets.ey.com. 2015. Available from: https://assets.ey.com/content/dam/ey-sites/ey-com/en_gl/topics/digital/ey-global-becoming-an-analytics-driven-organization.pdf
Search for articles and topics on Wevolver
Tags